6 min read

Housing prices continue to soar, rates are likely to maintain a steady upward trajectory, inflation and market adjustments are recalibrating risk, and real affordability is challenged. Together, the conditions created by these elements have caused many to utter the most fearful term used in any market today…bubble.
Are we in a housing bubble?
Prior to the collapse of the real estate market in 2008, national inventory levels had reached an almost 50-year peak, home buying sentiment was at a high, and median home value saw an historic high benchmark. The conditions surrounding this period and, generally, any asset bubble, follows a predictable trend. There is a euphoria that leads droves of market participants jumping in, the supply of the asset is readily available relative to its time, speculative investment is rampant, and pricing is driven by sentiment rather than performance. Today, “bubble” conditions, as we would generally think of them, simply do not exist. That does not mean; however, we do not have important issues to contend with.
The Inventory Component
On a national level, overall months of inventory has been volatile since the beginning of the COVID pandemic. Its performance tracked in line with both its response to the subsequent recession as well as its reaction following government stimulus.
Every recession since the 1960’s has seen a significant housing inventory peak mark the end of the expansionary period. There has been two exceptions, the 2000 dot com bubble pop and the 2020 COVID recession (see Fig 1).
Fig 1 – Historic Inventory
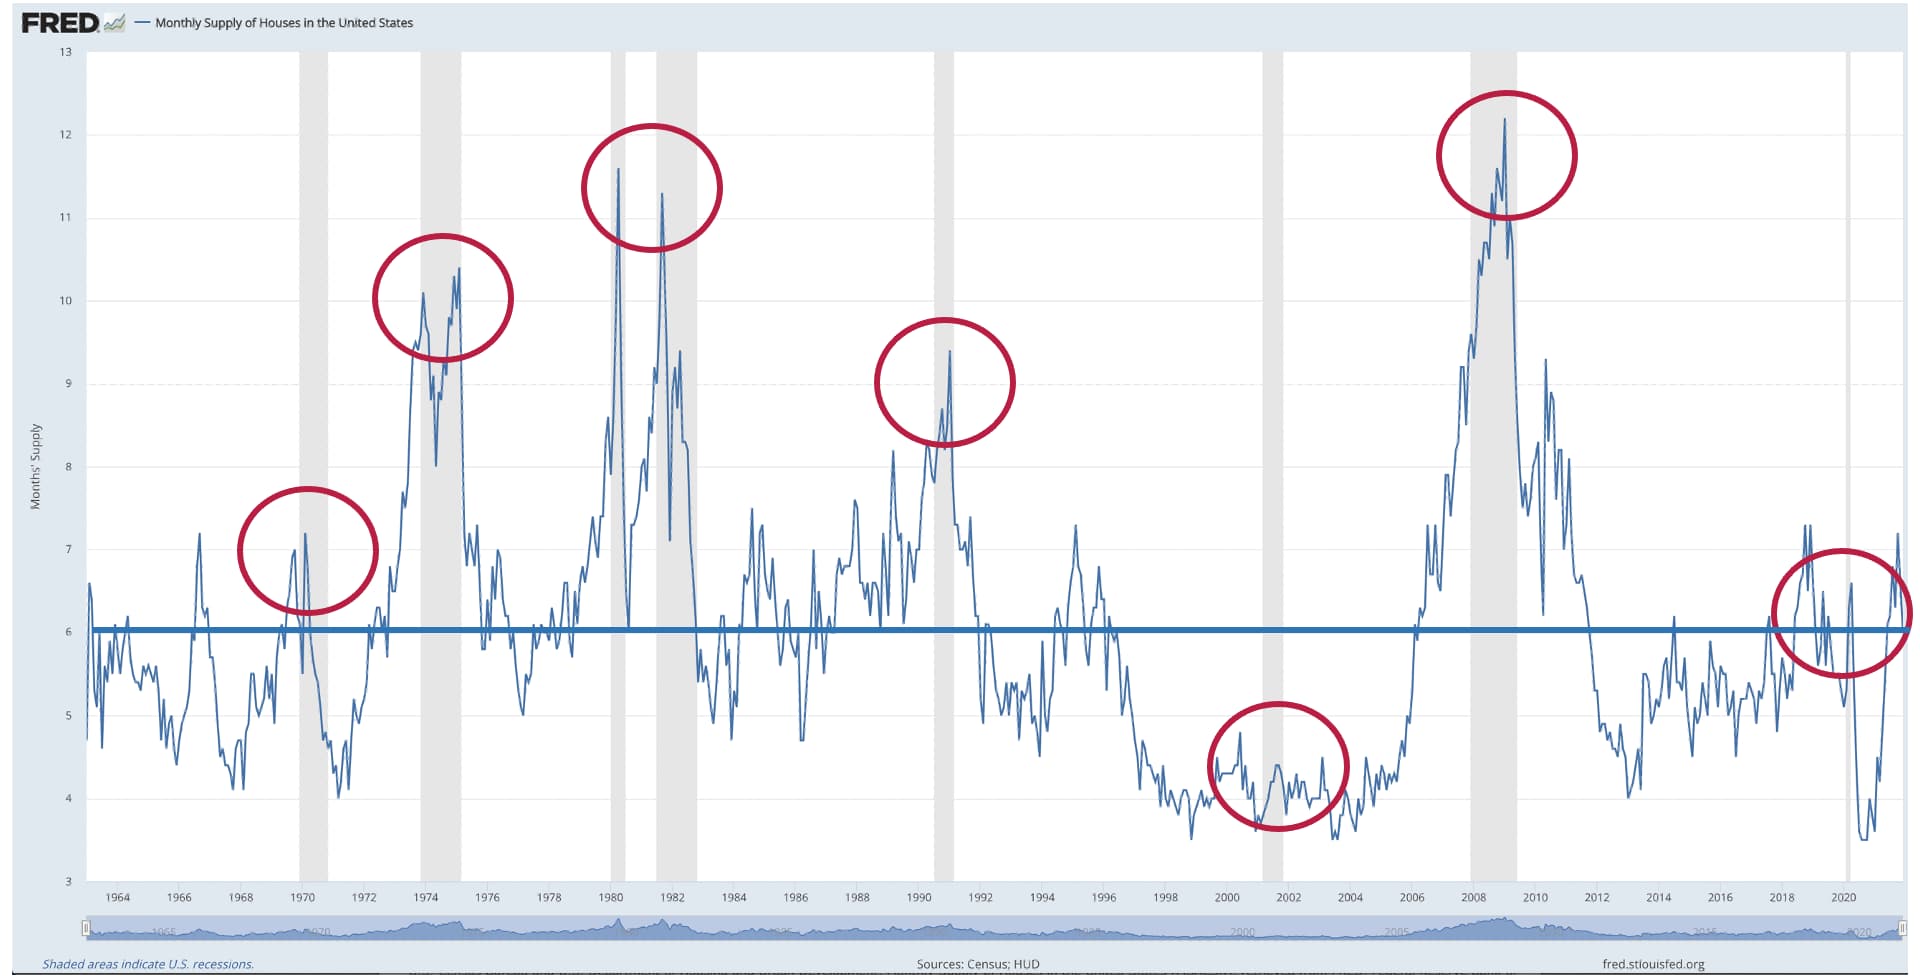
Source: St. Louis Federal Reserve Branch
Over this same period, 1960’s – present, the direction of inventory has, for the most part, tracked along with Federal Reserve’s Effective Funds Rate with a slight lag before and after each cycle. The underlying logic with this similar movement trajectory underscores the power of the rate lever the Fed pulls forward and back.
Following each recessionary period, the Fed eases its rate policy which, in turn, incentivizes investment. The upward and downward movement of inventory follows similarly with the direction of Fed rate policy. The overall growth or decline of the housing market is generally seen as an indicator to more broad economic performance, hence inventory’s tracking along with rate movement (see Fig 2).
Fig 2 – Historic Inventory w/Fed Funds
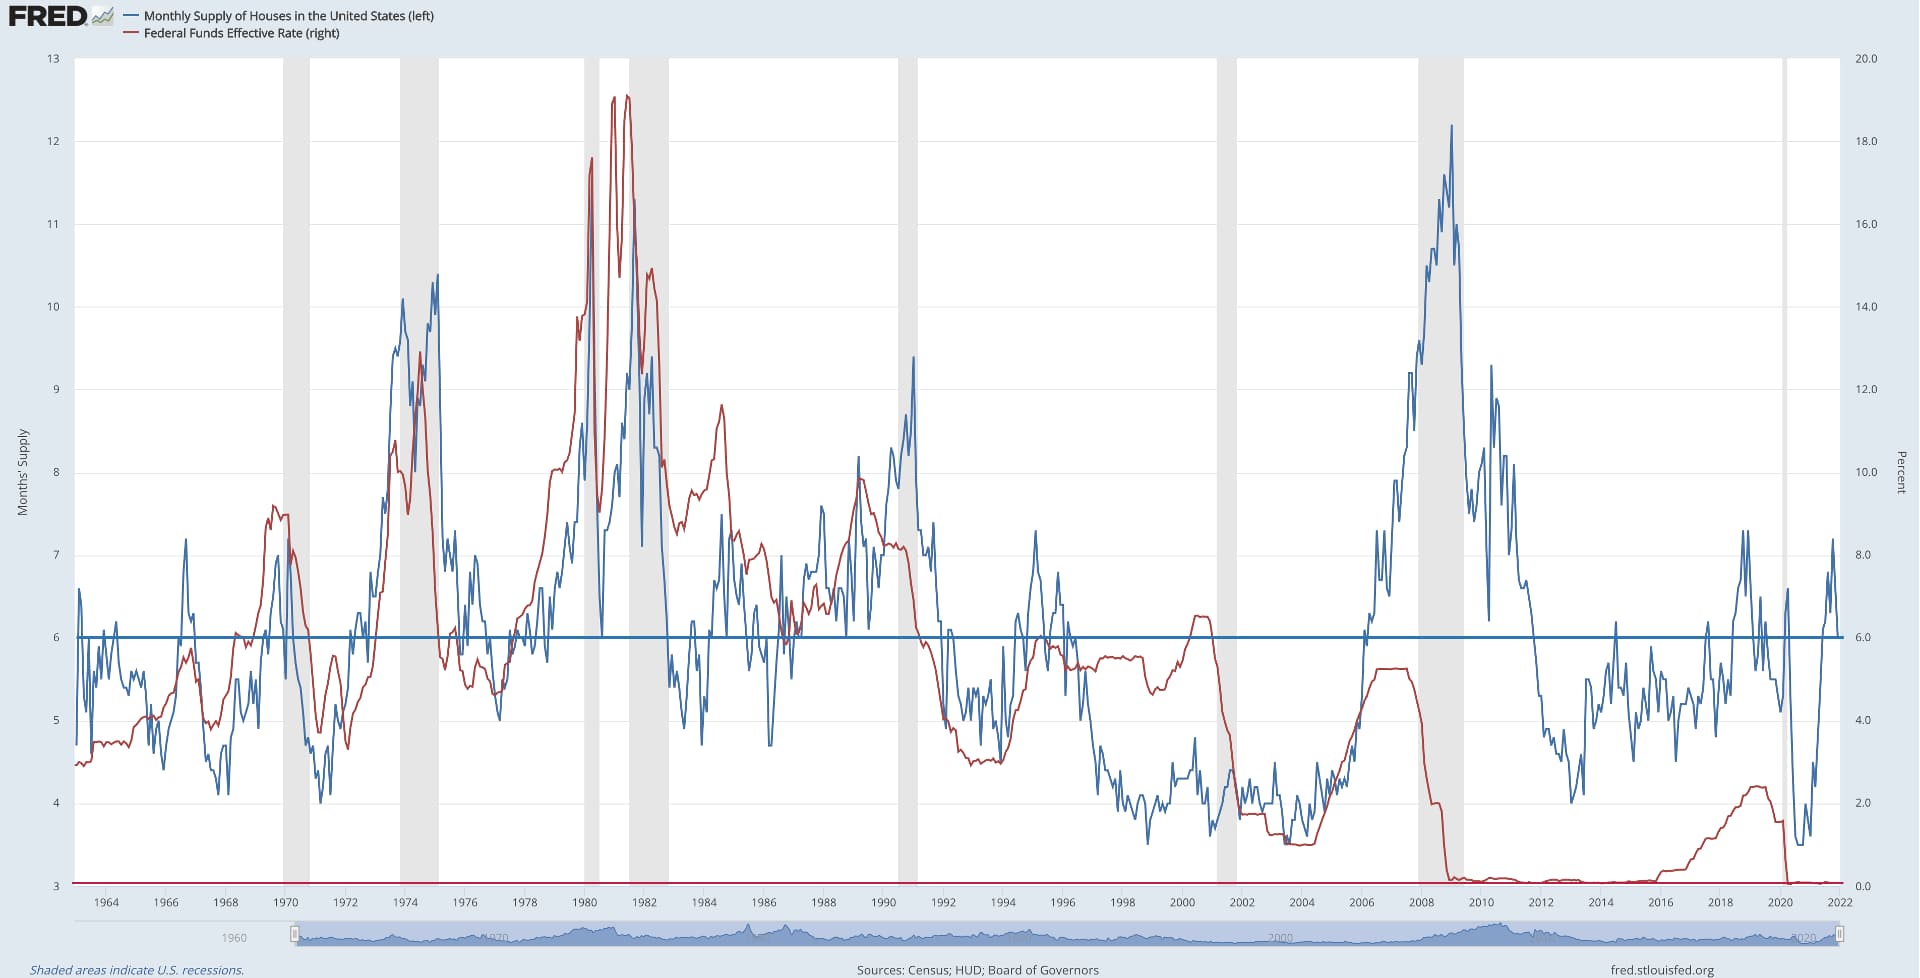
Source: St. Louis Federal Reserve Branch
Since the 1990’s, housing starts in comparison to inventory and the Fed funds rate gives us the optic into overall housing directionality.
Clinton era housing policy is largely attributed to the underlying cause of the 2008 housing crisis. Aggressive lending regulation throughout the duration of the administration forced lenders to provide credit to low income or credit risk borrowers and provided the impetus to risky high loan to value products and the abandonment of the 20% down rule. These practices eventually led to what we call “no doc loans” today.
The Bush administration then began its tenure with the bursting of the dot com bubble, sending the Federal Reserve into overdrive and pushing rates down from 6.5% to 1.75% over just a single year. This rapid policy shift gave the housing market the juice it needed to lift housing starts to levels not seen since the boomer era of the 1970’s (see Fig 3 & 4). This is the driver behind why we saw housing absorption continue and did not see the expected major spike in inventory during this recessionary period.
Fig 3 – Historic Inventory w/Fed Funds & Housing Starts
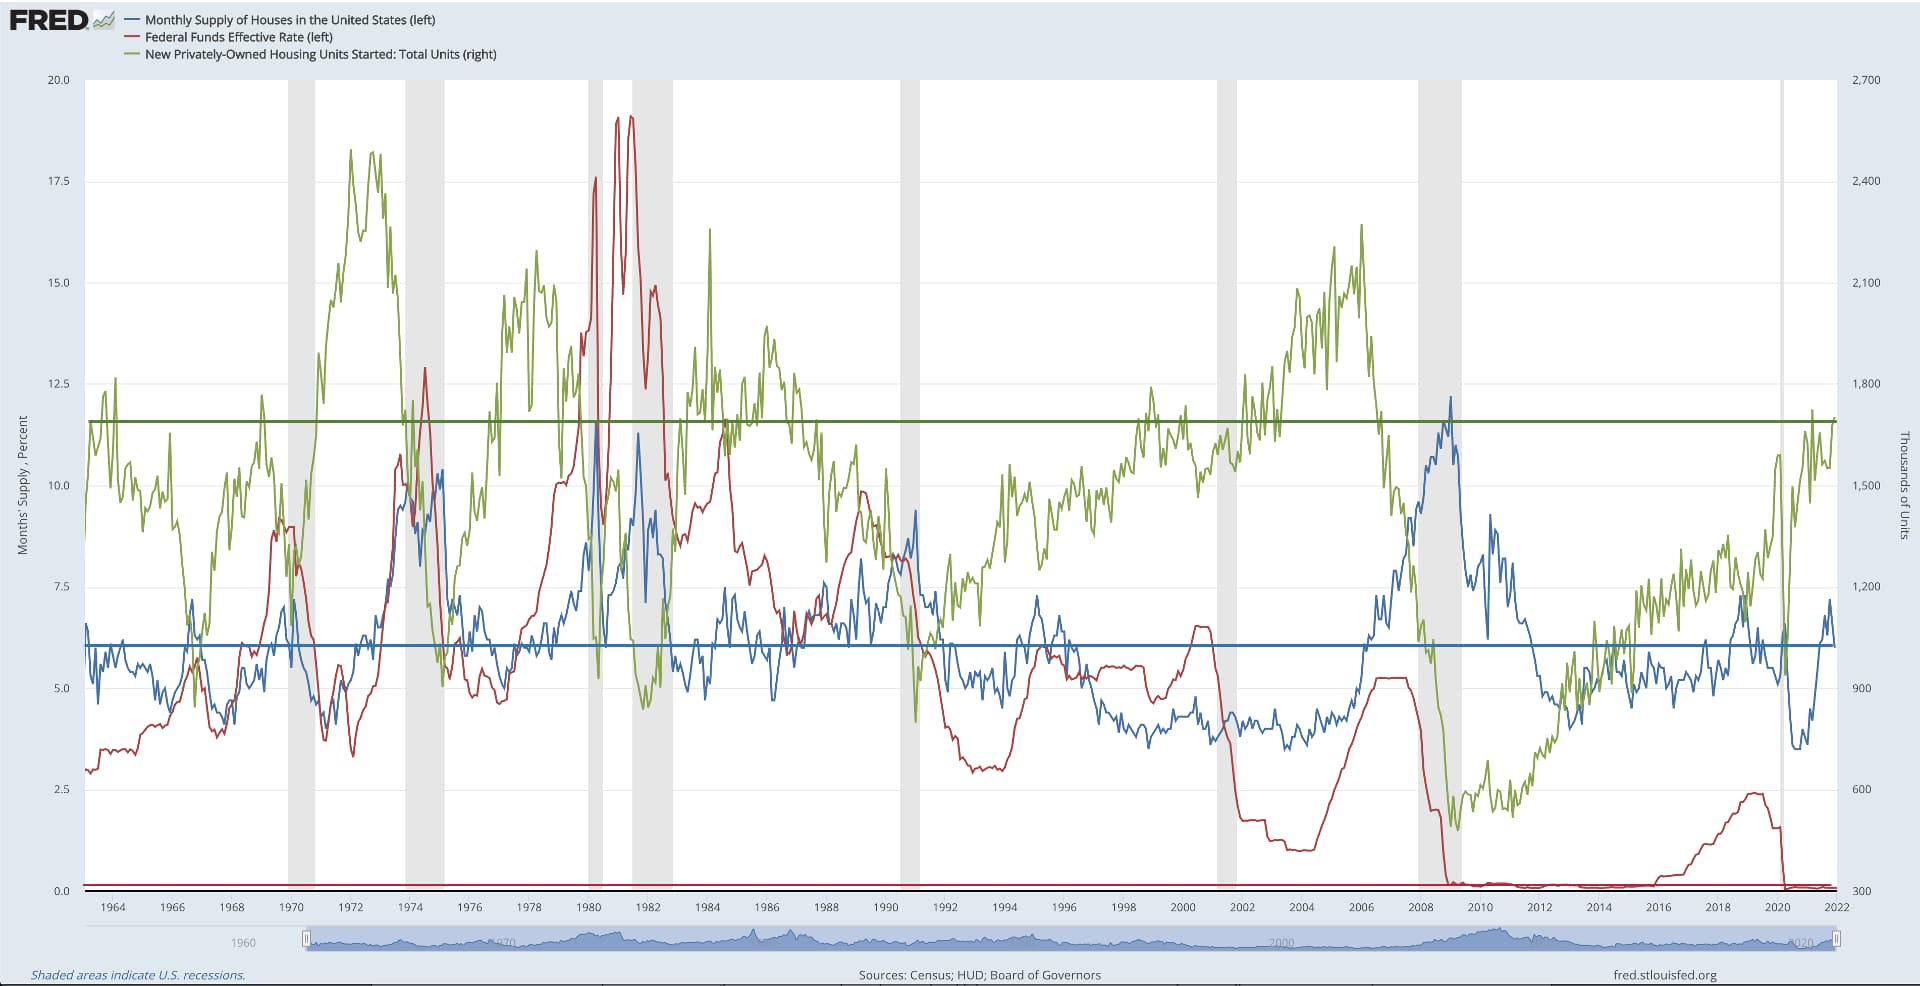
Source: St. Louis Federal Reserve Branch
Fig 4 – Inventory w/Fed Funds & Housing Starts (1995-Present)
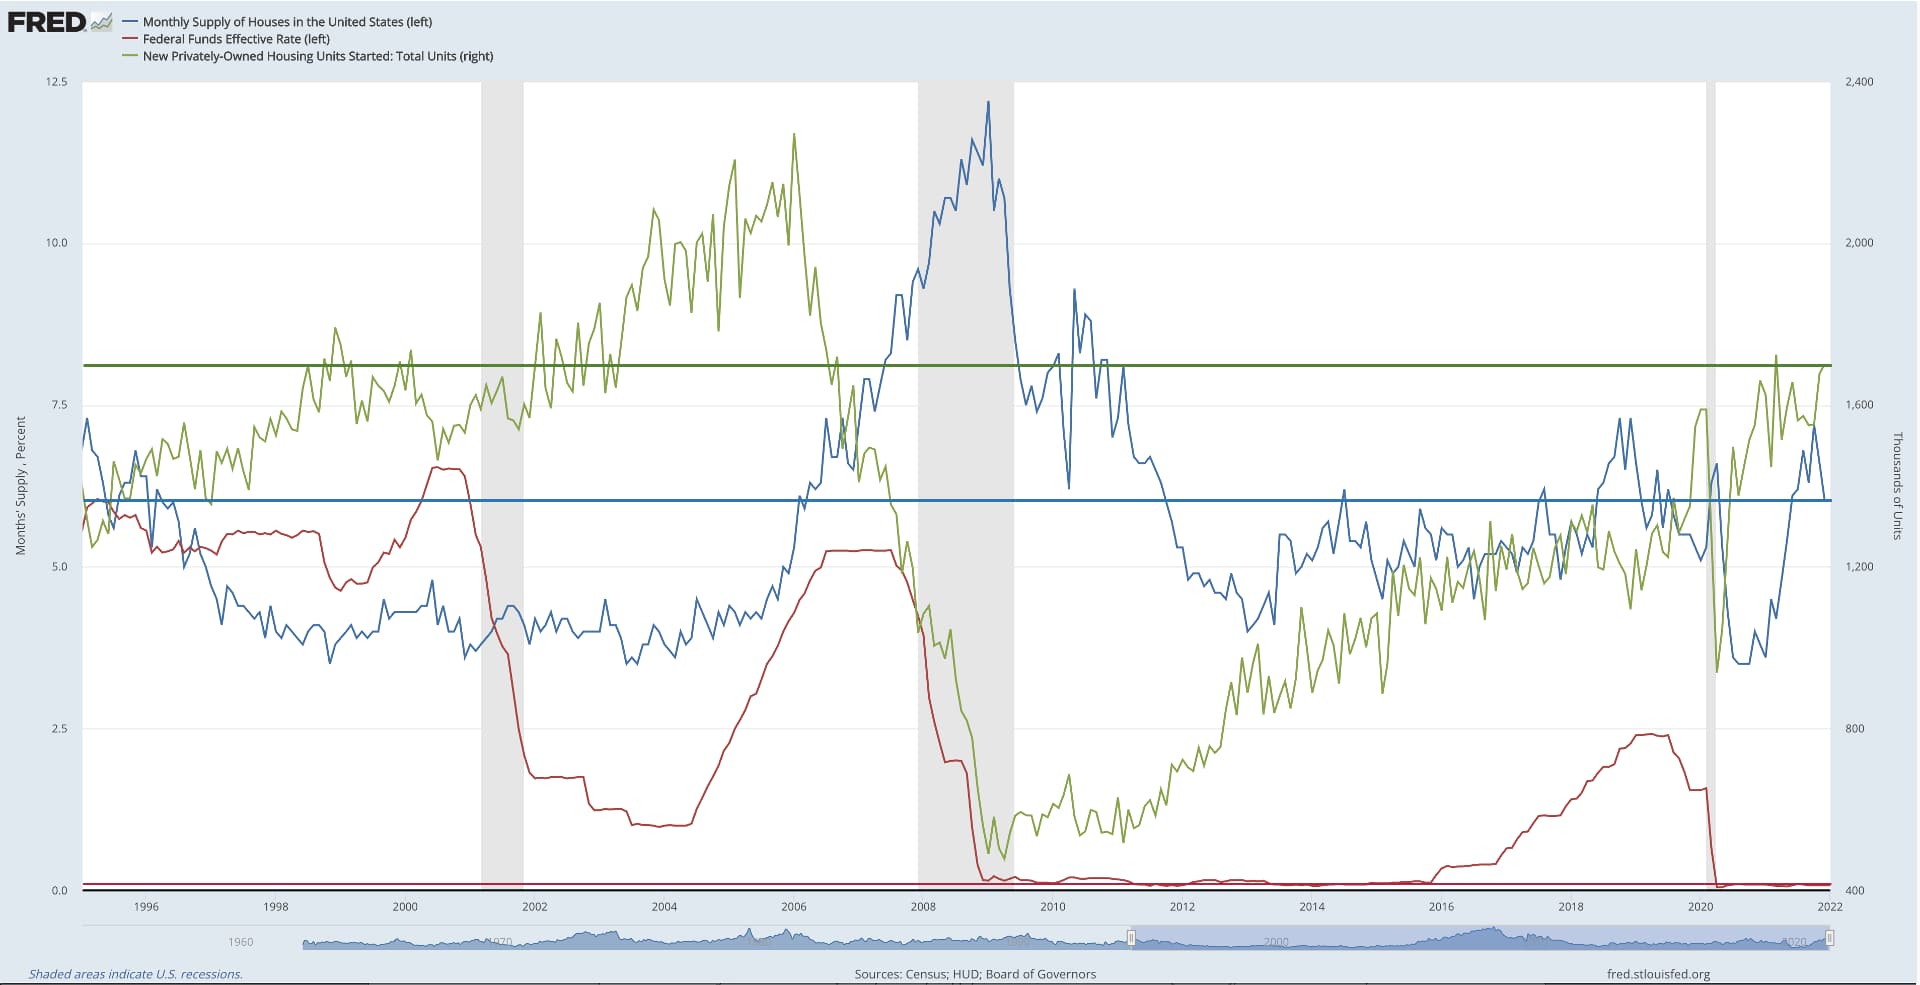
Source: St. Louis Federal Reserve Branch
In keeping with government almost never reversing bad policy, the Bush administration continued down the road of what it called “Compassionate Conservatism” and allowed Clinton era housing policies to not only continue but expand…and expand they did. Ultimately, as we all know, the continuation of these policies led to the implosion of the housing market and the economy, the catastrophe of which, became the fuel underneath the Obama administration’s Change moniker.
Inventory absorption dramatically slowed in 2006 and 2007 leading to the tremendous inventory spike we see during 2008 and 2009, again causing the Federal Reserve to drop rates to the floor. It then took from 2009 to 2013 for inventory to be absorbed and level down to an historic average. During this absorption period, housing starts dropped to lows never seen in recorded history.
The Fed’s policy during these years was to keep rates at zero. Over time, this not only allowed the housing market to recover, but boom beyond many previous sales or value related performance metrics. Inventory, however, never really came back.
Today, as a result of the 2008 housing crisis and subsequent lending policy, rolling back some of the Clinton era lending policies, buyers in the market have been vetted and are, generally, credit worthy. From 2013 to the present, interest in housing has only grown and kept ahead of supply, leading to where we are today with abysmally low inventory in most active real estate markets across the country. Here in Orange County, Florida, we have less than one month of total supply. Even in the top ends of the market, the luxury sector, we have only 2.5 months of supply.
The Sentiment & Supply Situation
Inventory conditions have been tremendously discouraging to buyers across all market areas and segments. Home buying sentiment has dropped tremendously as lack of supply with surging value keep many on the sidelines. Real affordability is keeping an entire generation of buyers out of the market, those in their 20’s and 30’s. These individuals are who we would consider first-time buyers. This rate and inventory equation has simply driven value out of reach.
The euphoria and excitement we would expect to see in a bubble environment is sorely absent today and what we are left with is a troubling supply and demand issue. The combination of all-time low interest rates coupled with surging demand has simply not given supply an opportunity to catch up.
The fall out from the 2008 housing crisis crippled new construction and extended the existing home sales cycle. Builders, both local and national, were much more cautious in land purchasing as well as the number of active projects in production at any given time. Existing home sellers, rather than moving on average every 4-6 years, they stayed between 6-10 years. The combination of these two factors, when considering how consistent housing demand was leading up to the pre-COVID period, then factoring the explosion of housing demand during the COVID period, we are left with what we see today.
Real affordability challenges are what drive the “bubble” references. Those challenges are real and will need to be maneuvered. There is no silver bullet solution and the years to come will be challenging for new market entrants and those who need financial mobility in real estate.
Whether we call the issue exploding value or depressed real income in the context of affordability, we do not see large-scale market speculation, artificial demand drivers as we saw leading up to 2008 (though Fed MBS purchases did artificially drive down rates), positive buyer sentiment, or readily available supply.
There is a lengthy conversation to be had about Fed policy and the drivers of asset values and influence across markets and the economy as a whole, but for our purposes here, simply put, the real estate market is not in a bubble.
About the Author: Click here